Medicare Reimbursements: Part B Lab Payments Slightly Down for 2016, Reports OIG
From - National Intelligence Report The OIG released its report on Medicare Part B payments for lab tests in 2016. The punchline: Lab payments over the past three years remain incredibly consistent in terms of… . . . read more

The OIG released its report on Medicare Part B payments for lab tests in 2016. The punchline: Lab payments over the past three years remain incredibly consistent in terms of both amount and reimbursement patterns. Here’s an overview of what you need to know about the OIG Report.
The Context
PAMA (the Protecting Access to Medicare Act of 2014) requires the OIG to monitor Medicare Part B payments for lab tests in advance of the new payment system scheduled to take effect on January 1, 2018. The September 2017 Report covers 2016, Year 3 of Baseline Data under the OIG PAMA monitoring mandate. Starting in 2018, CMS will update the Clinical Laboratory Fee Schedule (CLFS) using the median of private payer rates, weighted by test volume, to establish a new payment rate that will then be updated every three years based on data supplied by labs. Switching to the new system will save Medicare $3.9 billion in lab payments over the next 10 years, the OIG claims.
2016 Medicare Lab Payments by the Numbers
In 2016, CLFS payments for lab tests totalled $6.8 billion, down slightly from the $7.0 billion Medicare paid in each 2015 and 2014. CLFS payments accounted for roughly 2% of all Part B payments made in 2016, as opposed to 3% in 2015. The table below shows where that money went.
How Medicare Spent Its $7 Billion for Lab Tests in 2016*
| Tests | Beneficiaries | Labs | Providers |
| 437 million: total tests billed 3.4: average number of tests received by beneficiaries per day 17: average number of tests per day for top 1% of beneficiaries |
28 million: beneficiaries that received at least one test 16: average number of tests per beneficiary 86: average number of tests per beneficiary among top 1% of beneficiaries |
58,593: labs that received Medicare payments $115,546: average payments per lab $1.1 billion: payments to top three labs |
635,773:providers that ordered lab tests 485: average tests ordered per provider 6,176: average tests ordered by top 1% of providers |
Source: OIG “Medicare Payments for Clinical Diagnostic Laboratory Tests in 2016”
* Note: For a comparison to 2015 data, see NIR, Oct. 28, 2016, page 1
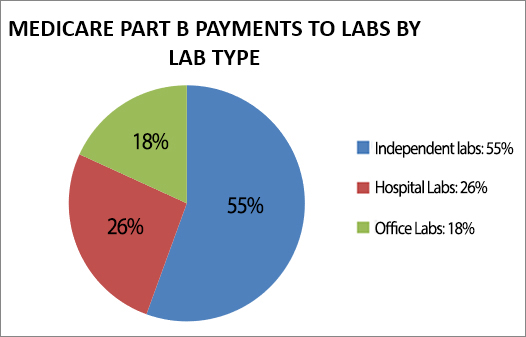
The chart below shows the breakdown of payments by type of lab:
What Medicare Paid for Top 25 Lab Tests
As required by PAMA, the OIG report includes detailed analysis of the 25 most frequently ordered lab tests. While the top 25 tests always generate the lion’s share of payments, that trend was even more pronounced in 2016:
Payments for Top 25 Lab Tests 2014-2016
2014$4.2 billion59%
| Year | Total | Percentage of All CLFS Payments |
| 2016 | $4.3 billion | 63% |
| 2015 | $4.1 billion | 58% |
Other Report findings for the top 25:
- 17 of the top 25 tests have been in the top 25 for all three years of the review;
- The top 6 tests accounted for $2.4 billion, or 35% of all payments for lab tests in 2016;
- Payments generated by the top 6 have increased by at least $2 million per year each year;
- The rankings of the top 6 tests have not changed in three years
Top 10 Lab Tests Based on Medicare Part B Payments in 2016
| Rank | Test Description and Procedure Code | National Limitation AmountNumber of Tests (in millions) | Number of Tests (in millions) | 2015 Medicare Payments (in millions) | Changes from 2015 Payments (in millions) |
| 1 | Blood test, thyroid-stimulating hormone (TSH) (84443) | $22.89 | 21.5 | $482 | +$7.4 |
| 2 | Blood test, comprehensive group of blood chemicals (80053) | $14.39 | 41.6 | $470 | +$11.7 |
| 3 | Complete blood cell count (red blood cells, white blood cells, platelets) and automated differential white blood cell count (85025) | $10.59 | 42.0 | $433 | +$5.5 |
| 4 | Blood test, lipids (cholesterol and triglycerides) (80061) | — | 29.0 | $411 | +$31.7 |
| 5 | Vitamin D-3 level (82306) | $40.33 | 9.0 | $350 | +$13.3 |
| 6 | Hemoglobin A1C level (83036) | $13.22 | 19.3 | $250 | +$9.8 |
| 7 | Drug test(s), definitive, 22 or more drug class(es), including metabolite(s) if performed (G0483) | $215.23 | 1.2 | $241 | New code in 2016 |
| 8 | Drug test(s), presumptive, any number of drug classes, per date of service (G0479) | $79.25 | 3.0 | $221 | New code in 2016 |
| 9 | Blood test, basic group of blood chemicals (80048) | $11.52 | 13.7 | $133 | -$0.7 |
| 10 | Drug test(s), definitive, per day, 15-21 drug class(es), including metabolite(s) if performed (G0482) | $166.03 | 0.8 | $127 | New code in 2016 |
Source: OIG “Medicare Payments for Clinical Diagnostic Laboratory Tests in 2016”
Payment Trends
Although total lab test payments changed little from the previous year, the Report cites significant year-to-year variances in payments for four particular types of tests.
1. Multianalyte Assays with Algorithmic Analyses (MAAA) Way Up
Payments for MAAAs combining multiple test results with other patient information to yield a predictive score, e.g., cancer recurrence risk or drug response, were up 665% year-over-year. The spike is not really surprising insofar as these are newly emerging tests that Medicare only started to cover in 2015. Medicare added 10 new MAAAs to its coverage list in 2016. However, the Report also points out that at an average $890 per test, MAAA tests are the most expensive category of CLFS tests.
2. Microbiology Tests Consistently Up
Payments for tests to detect and identify infection-causing microorganisms have climbed consistently in the past three years:
- 2014: $472 million;
- 2015: $517 million;
- 2016: $570 million.
3. Drug Tests Go from Up to Down
After increasing 19% to $1.1 billion the previous year, drug tests made a u-turn dropping to $880 million in 2016. Probably not coincidentally, CMS changed its payment formula for drug tests in 2016. Rather than paying separately for each drug class tested for, the agency paid a set amount for multiple tests, regardless of drug class targeted by testing. Still, seven of the top 25 tests for the year were for the newly assigned drug testing codes.
4. Molecular Pathology Tests Continue to Decline
Medicare payments for molecular pathology tests analyzing genetic material to determine how patients will respond to treatment decreased 44% from $466 million to $259 million in 2015. The trend continued in 2016 with payments falling to $165 million. The decline coincides with OIG efforts to prevent medically unnecessary genetic testing, the Report adds.
Subscribe to view Essential
Start a Free Trial for immediate access to this article