Don’t Crash & Burn: Why Cutting Your Quality Department’s Budget is not a Good Idea
By Jennifer Dawson, MHA, DLM (ASCP) bio Do you think that you can improve your organization's bottom line by reducing the budget to your quality program and cutting its staff… . . . read more

By Jennifer Dawson, MHA, DLM (ASCP) bio
Do you think that you can improve your organization’s bottom line by reducing the budget to your quality program and cutting its staff? Think again.
When articulating the value of a quality program, the Cost of Quality (CoQ) is a useful concept. The Cost of Quality is equal to the Cost of Good Quality Plus the Cost of Poor Quality (CoPQ). (Refer to figure 1 below for a visual representation of the breakdown of CoQ).

Figure 1: Cost of Poor Quality Breakdown
The cost of good quality consists of appraisal and prevention costs. Prevention costs are incurred to prevent or avoid quality problems. These costs are associated with the design, implementation, and maintenance of the quality management system. Prevention costs could include things like quality planning, developing and maintaining your Quality Management System (QMS) and quality improvement projects. Appraisal costs are associated with measuring and monitoring activities related to quality. I work in clinical laboratories, so in my setting prevention costs include things like competency assessments, calibration, quality control and proficiency testing. Quality audits, including internal audits performed by the laboratory as well as certification and accreditation inspections performed by external agencies, are also appraisal costs.
[freereport]
The cost of poor quality (CoPQ) consists of internal and external failure costs. Internal failure costs are incurred to remedy defects discovered before the product or service is delivered to the customer. They could include time lost due to instrument downtime and inefficiencies, rework or rectification (including reruns, recovering missing specimens, recollecting specimens, correcting data entry errors and repairing equipment) and costs associated with investigations and root cause analysis when there are failures. External failure costs are incurred to remedy defects discovered by customers. They could include costs associated with complaints (including all work and costs associated with handling and servicing customers’ complaints), misdiagnoses and associated costs to the organization, harm to the patient, corrected reports and malpractice and other lawsuits.
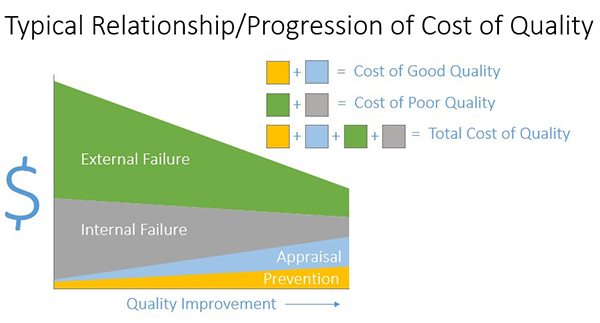
Figure 2: Typical Relationship/Progression of Cost of Quality
Figure 2 is a diagram that you can use to demonstrate the typical progression that occurs as you improve quality in your organization (not to scale). The x axis shows quality improving left to right. The y axis is dollars. Before you invest in quality through appraisal and prevention, costs of good quality, your cost of poor quality will be high. You can see this by combining the green and grey on the left of the graph. As you invest in quality through prevention and appraisal moving right (cost of good quality—light blue and yellow costs), you can see that your overall cost of quality decreases. It is a common view among management that higher quality means higher cost. You can use this diagram to articulate why cutting resources to your quality program will likely not result in overall cost savings for the organization.
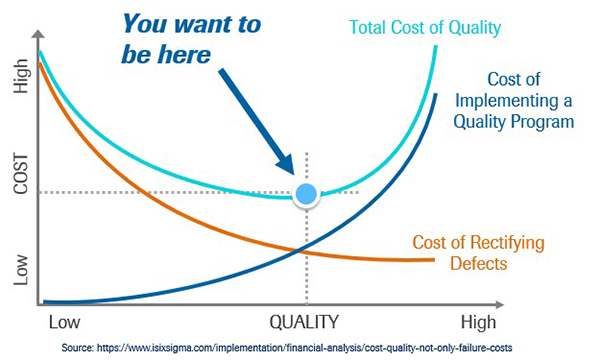
Figure 3: Finding the “sweet spot”
Figure 3 shows the relationship between the cost of good quality represented by the blue line and the cost of poor quality, represented by the orange line. The total cost of quality is represented by the green line. I would say that the majority of organizations that I have encountered are to the left of the “sweet spot”, the blue dot which represents the lowest total cost of quality. An organization that falls to the left of the sweet spot for Total Cost of quality has not yet invested enough money in their quality efforts to realize their lowest possible total cost of quality.
This figure is pretty important. How often do we hear of quality personnel being laid off due to budget cuts? Organizations must resist the urge to realize short-term savings by cutting resources to quality efforts. It is a well-researched and thoroughly documented fact that investment in quality pays off. It is incorrect to assume that expending fewer resources towards quality will save the business money (2).
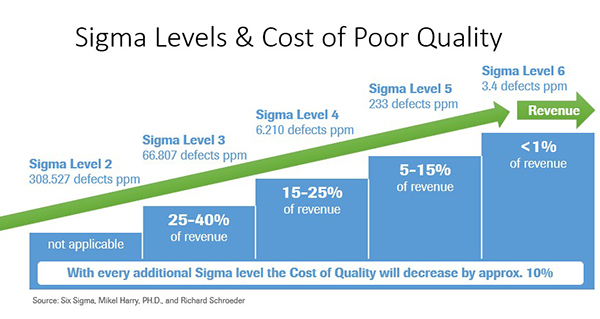
Figure 4: Sigma Levels and the Cost of Poor Quality
Labs with Lean Six Sigma programs aimed at improving efficiencies and reducing variability experience a lower total cost of quality due to reduction in CoPQ. Sigma levels correspond to the number of defects per million opportunities (DPMO) for a given process-the higher the sigma level, the lower the DPMO.Six Sigma is a world-class goal reflecting a very low level of variability, 3.4 defects per million opportunities to be exact.
Interestingly and not surprisingly, there is a correlation between defect rates and cost of quality which is represented in Figure 4. Labs with high defect rates experience very high total costs of quality. This is due to increased cost of poor quality resulting from a high percentage of rework and rectifying defects.
Labs achieving a high level of quality expend fewer dollars on total cost of quality. This is due to the majority of their quality costs coming from costs of good quality, such as prevention and appraisal. Cutting resources to a quality program will result in short-term savings, but will cost the lab significantly more in the long term. With higher sigma levels and thus lower variation, you have happy customers. With lower CoPQ figures that accompany higher sigma levels, you make more money.
Organizations need to shift the thinking of their quality department from a being cost center, an expensive and necessary evil usually in place for regulatory compliance or to enforce minimum standards, to a function that provides cost savings, cost avoidance and risk reduction in addition to improvement in efficiency, quality and customer/patient satisfaction.
Continuous progression for quality will reduce costs, result in the strategic advantage of differentiation in the marketplace through quality, while providing the peace of mind that comes with offering the very best care for your patients and/or service for your customers and clients.
Consider if your organization’s quality went from 6 sigma to 3 sigma and lost ~20% of revenue or consider if your organization followed the unfortunate path, what I call the downward spiral of CoPQ, in figure 5 (below). Don’t let your organization crash and burn. Commit to excellence and invest in quality.
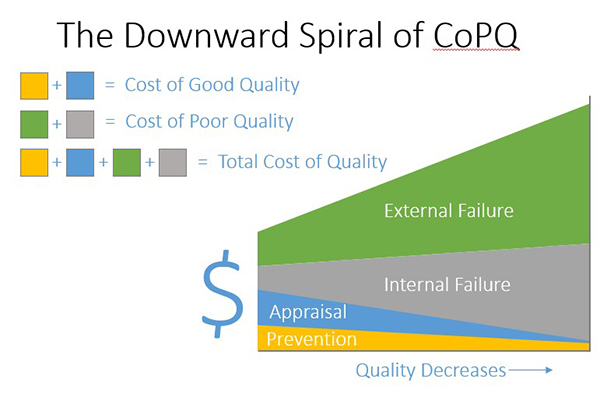
Figure 5: The Downward Spiral of CoPQ
References and Resources
American Society for Quality, www.asq.org
https://www.isixsigma.com/implementation/financial-analysis/cost-quality-not-only-failure-costs
Six Sigma, Mikel Harry, PH.D., and Richard Schroeder
Dawson J. What’s Your CoPQ: Quantifying the Value of Laboratory Quality. Medical Laboratory Management Magazine. July 2017. https://www.medlabmag.com/article/1393
CLSI. Understanding the Cost of Quality in the Laboratory; A Report. CLSI document QMS20-R, PA: Clinical and Laboratory Standards Institute; 2014
CLSI certificate program on implementing the Cost of Quality in the lab (https://clsi.org/education/coq/).
About the author: Jennifer Dawson, MHA, LSSBB, CPHQ, DLM(ASCP)SLS, QLC, QIHC is a Lab Quality Management Leader and a passionate advocate for lab quality and patient safety.
Jennifer specializes in development, deployment and redesign of best practice Quality Management Systems and fostering a culture of quality. She is well versed in laboratory regulatory affairs, quality management, performance excellence, process improvement, metric development, quality improvement, internal auditing, safety and operations. She has extensive experience in CAP, CLIA, state licenses and ISO 15189.
She is currently Senior Director, Quality, for Human Longevity, Inc.; Affiliate Faculty, Health Services Administration at Regis University. Ms. Dawson sits on the CLMA Board of Directors, the CLSI Quality Management Systems & General Practices Expert Panel, and the AACC Management Sciences & Patient Safety Division. She has served on the National Malcolm Baldrige Quality Award Board of Examiners and currently serves on the ASCLS Patient Safety Committee and the AACC Management Sciences and Patient Safety Executive Committee. She also takes on occasional consulting engagements (www.pinnaclelabquality.com).
| Editor’s picks: | ||
From – TRAINING ON DEMAND
|
From – G2 Blog
|
From – G2 Compliance Advisor
|
Subscribe to Clinical Diagnostics Insider to view
Start a Free Trial for immediate access to this article